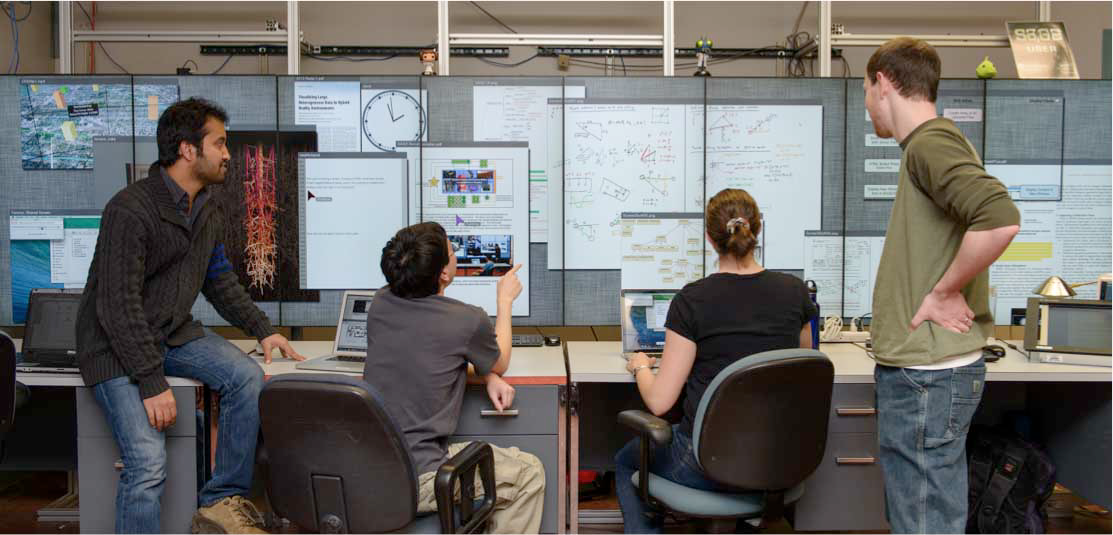
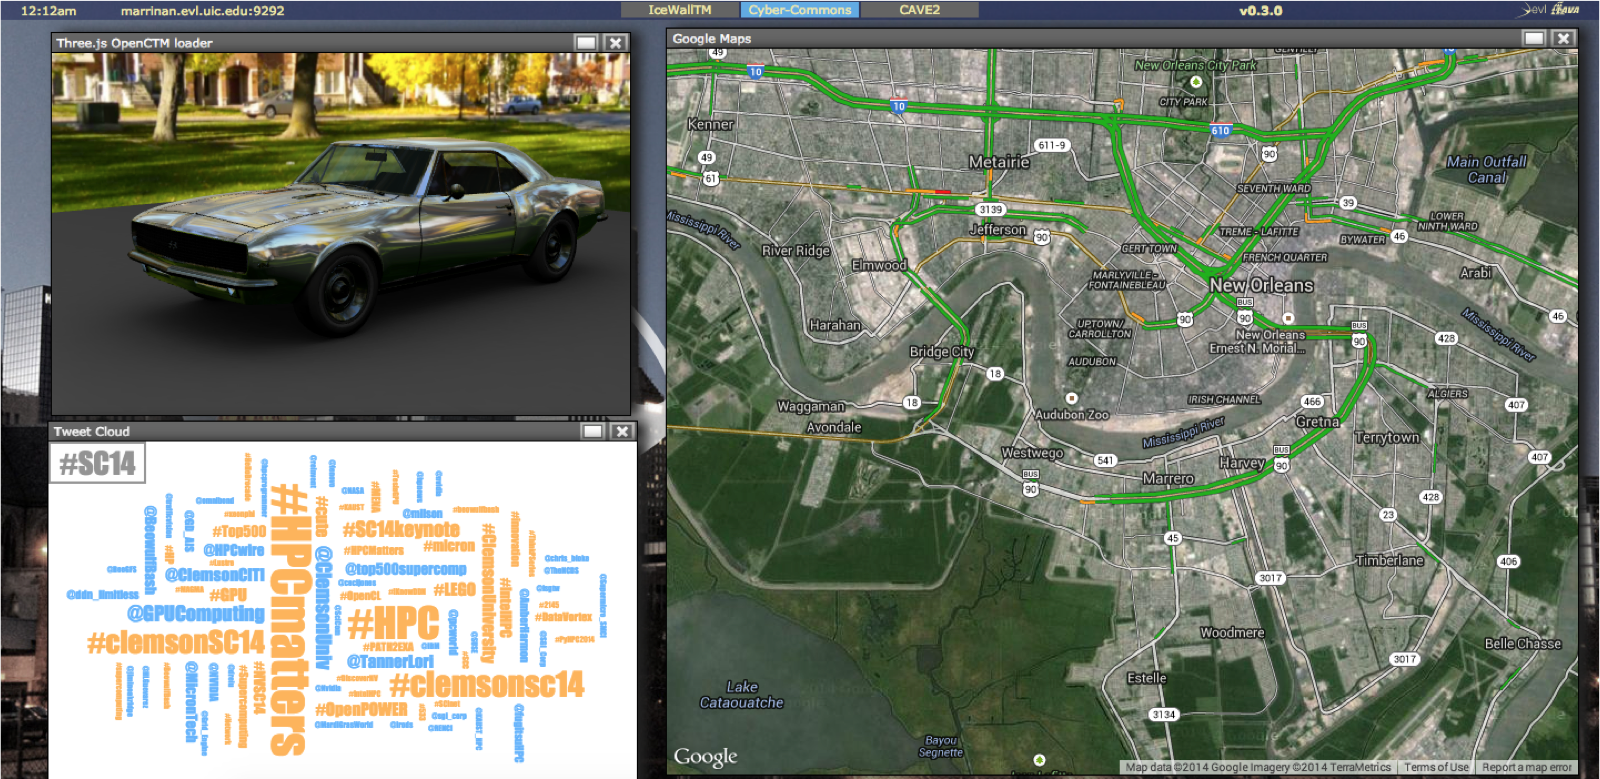
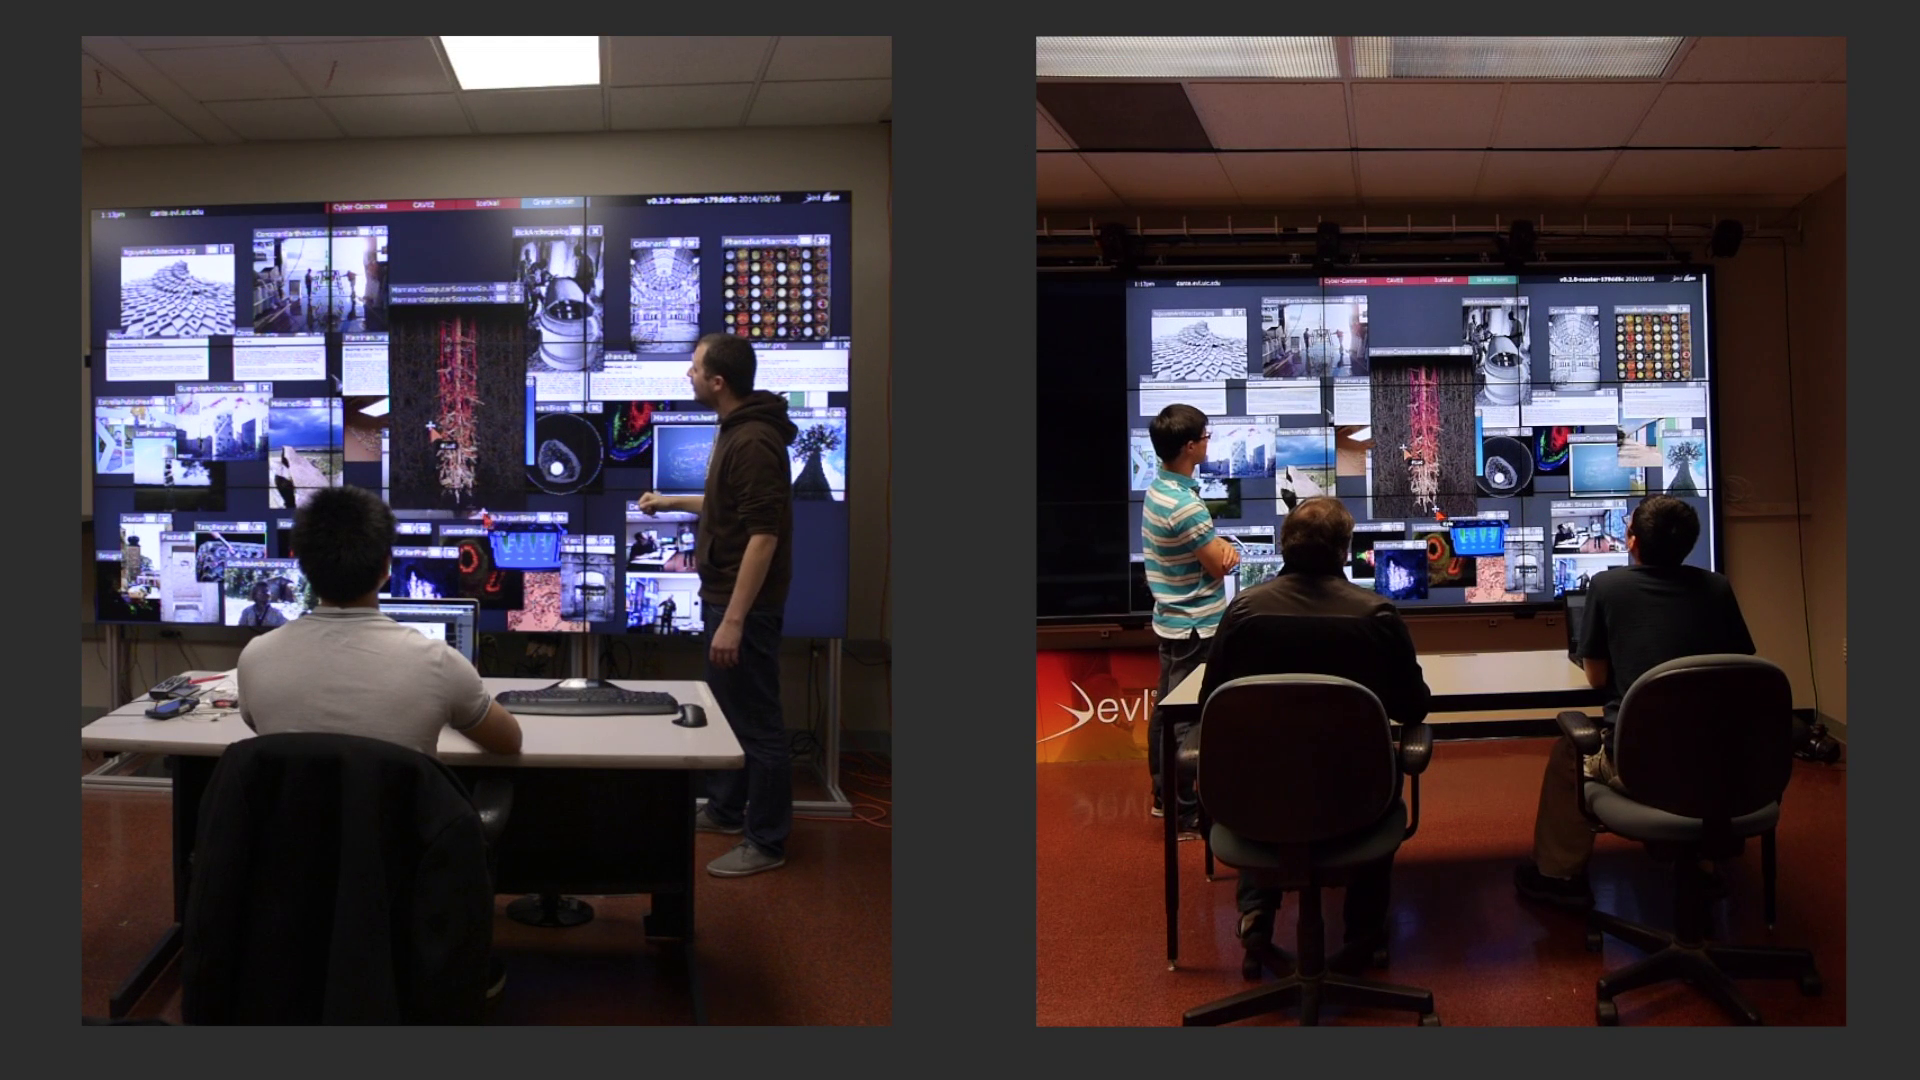
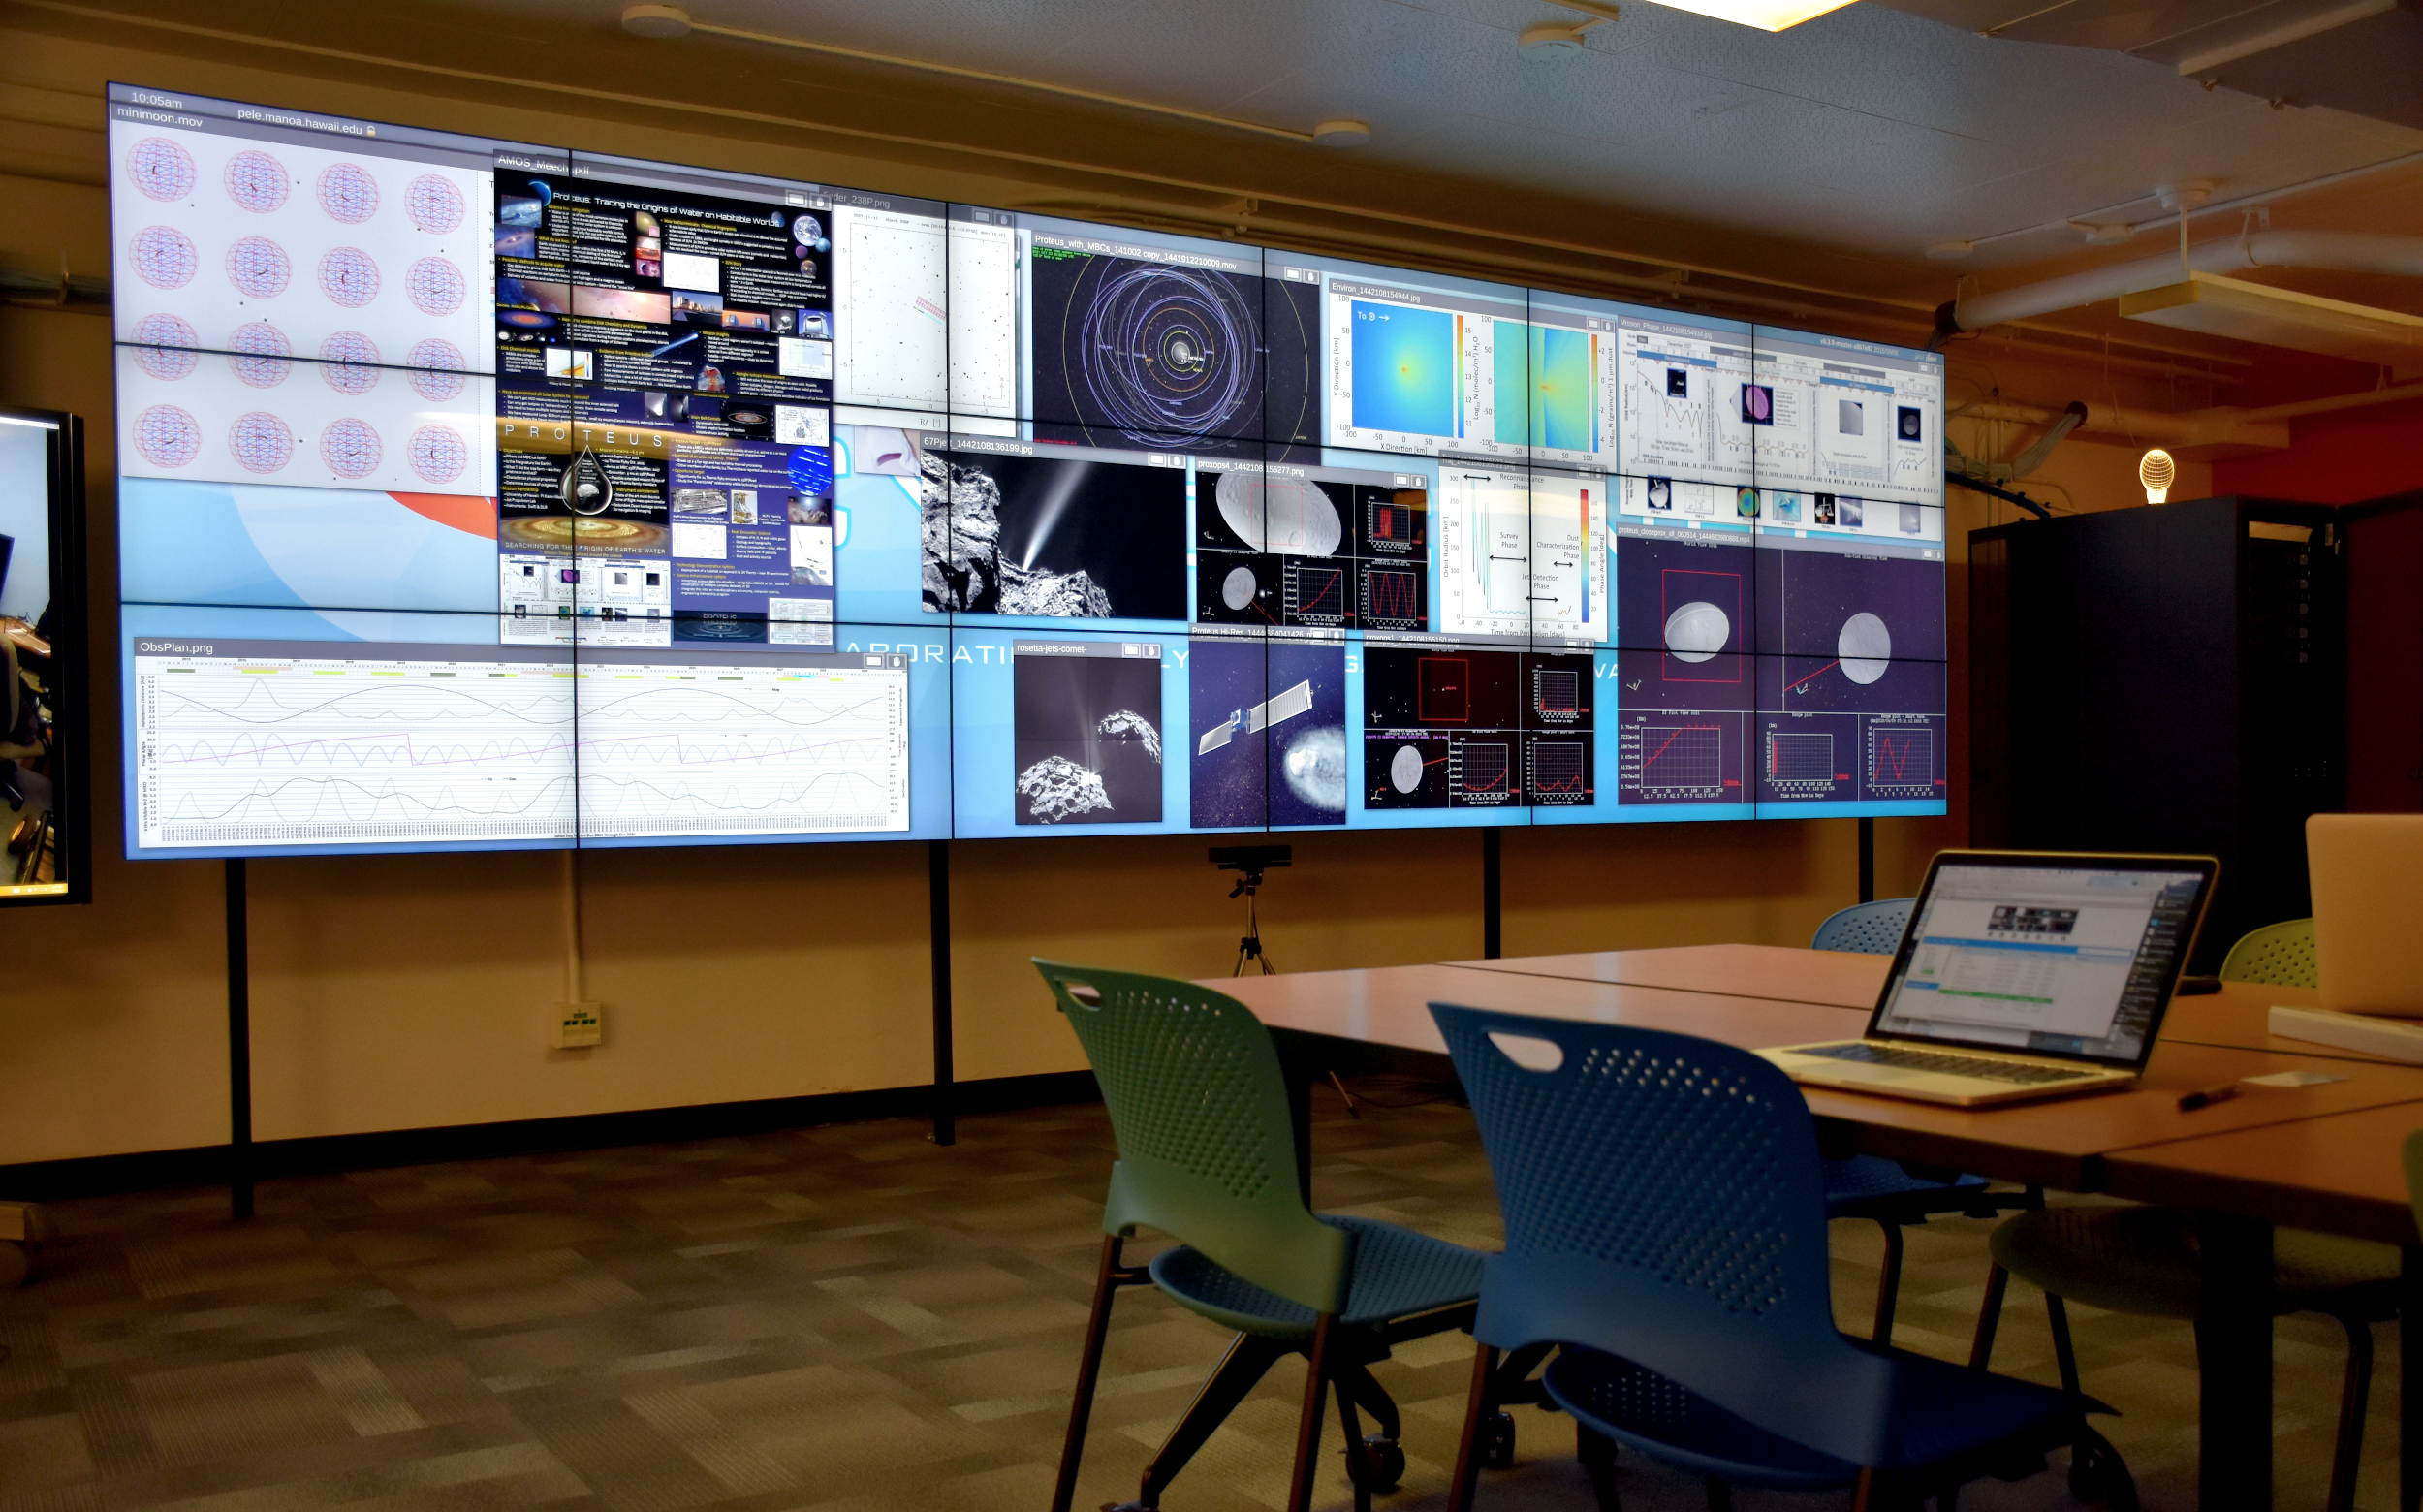
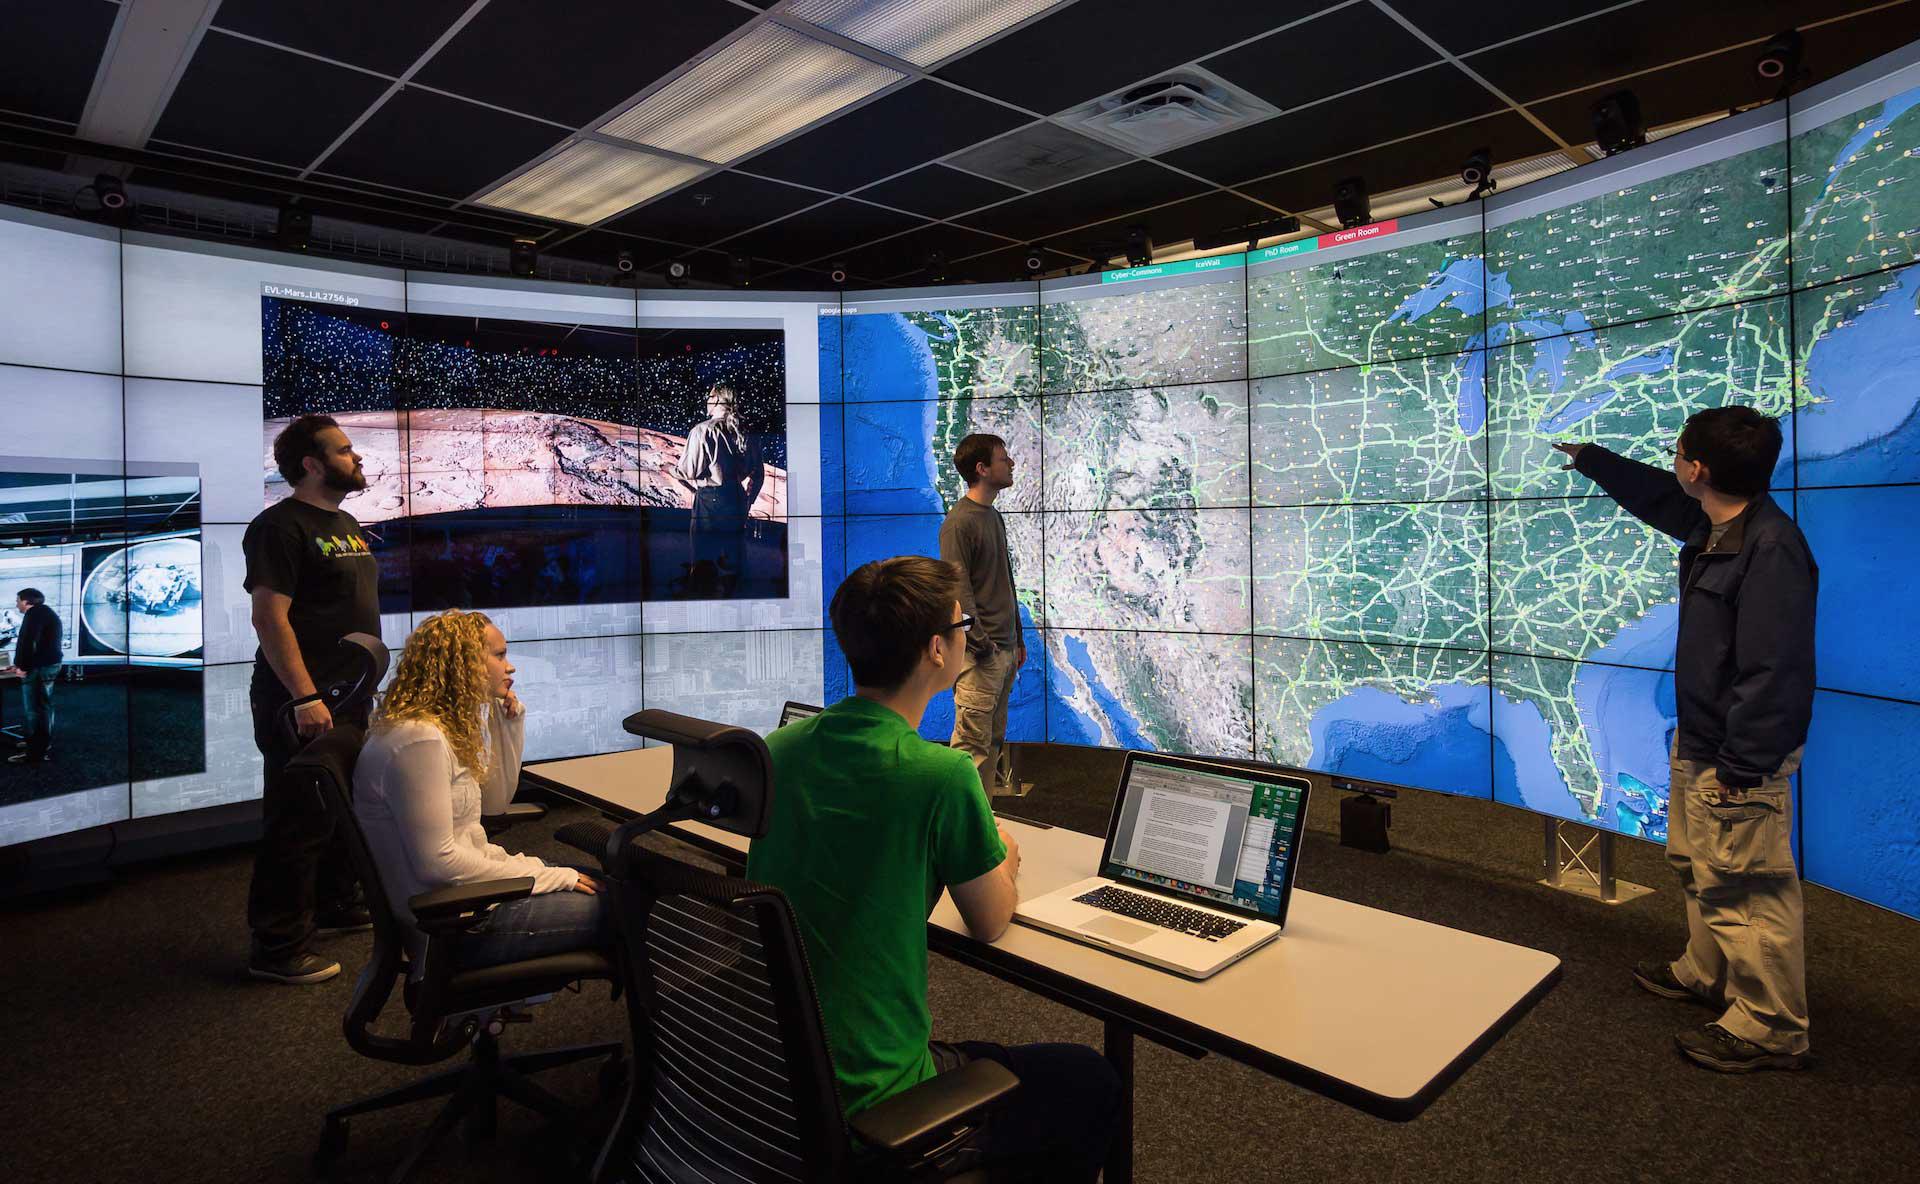
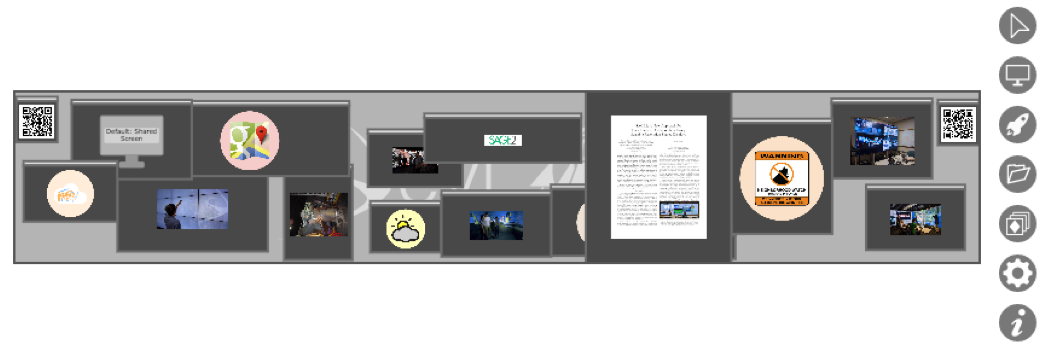
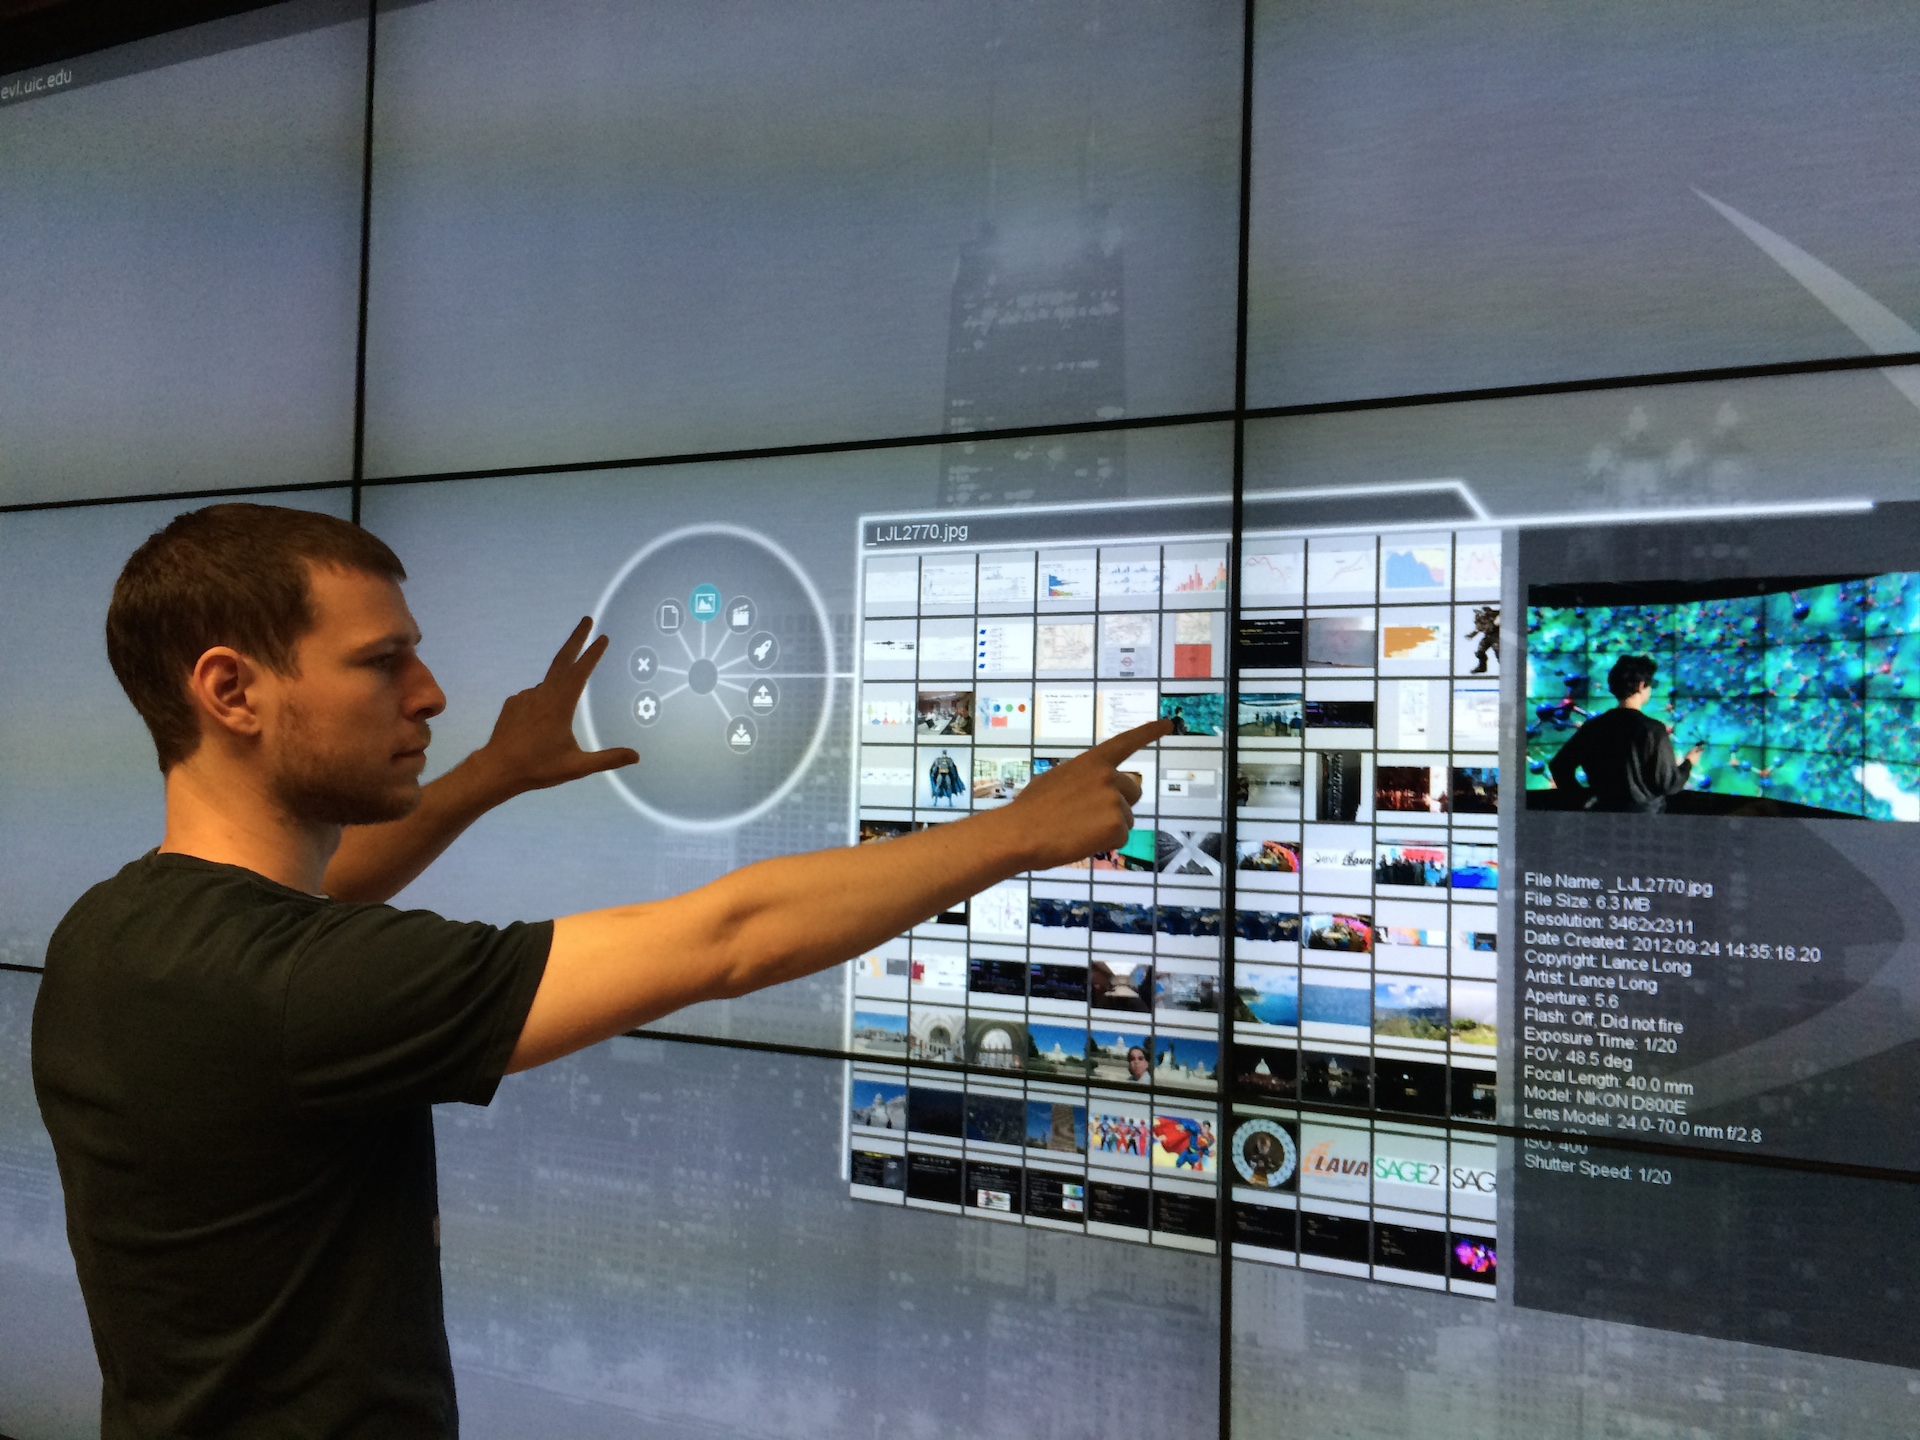
We will demonstrate SAGE2 (Scalable Amplified Group Environment) tool, a webtool developed by Electronic Visualization Laboratory (University of Illinois at Chicago), designed to enable groups to work in front of large shared displays in order to solve problems that required juxtaposing large volumes of information in ultra high-resolution. SAGE2 will be used by RCC with a Visualization Tiled Display Wall to enable multi-user interaction and remote collaboration. Bring your laptop/tablet/smartphone.


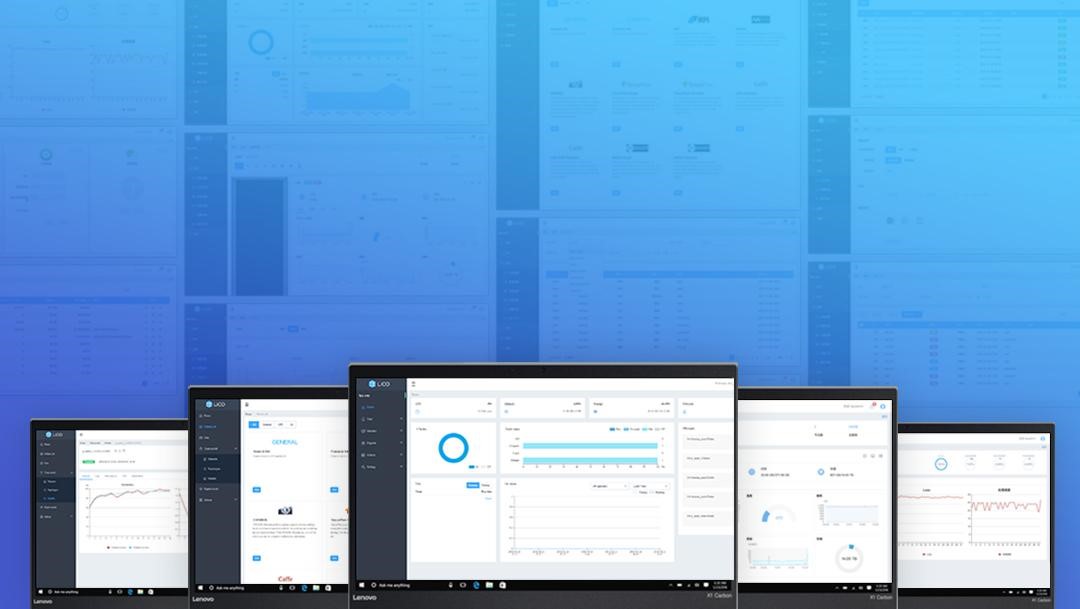
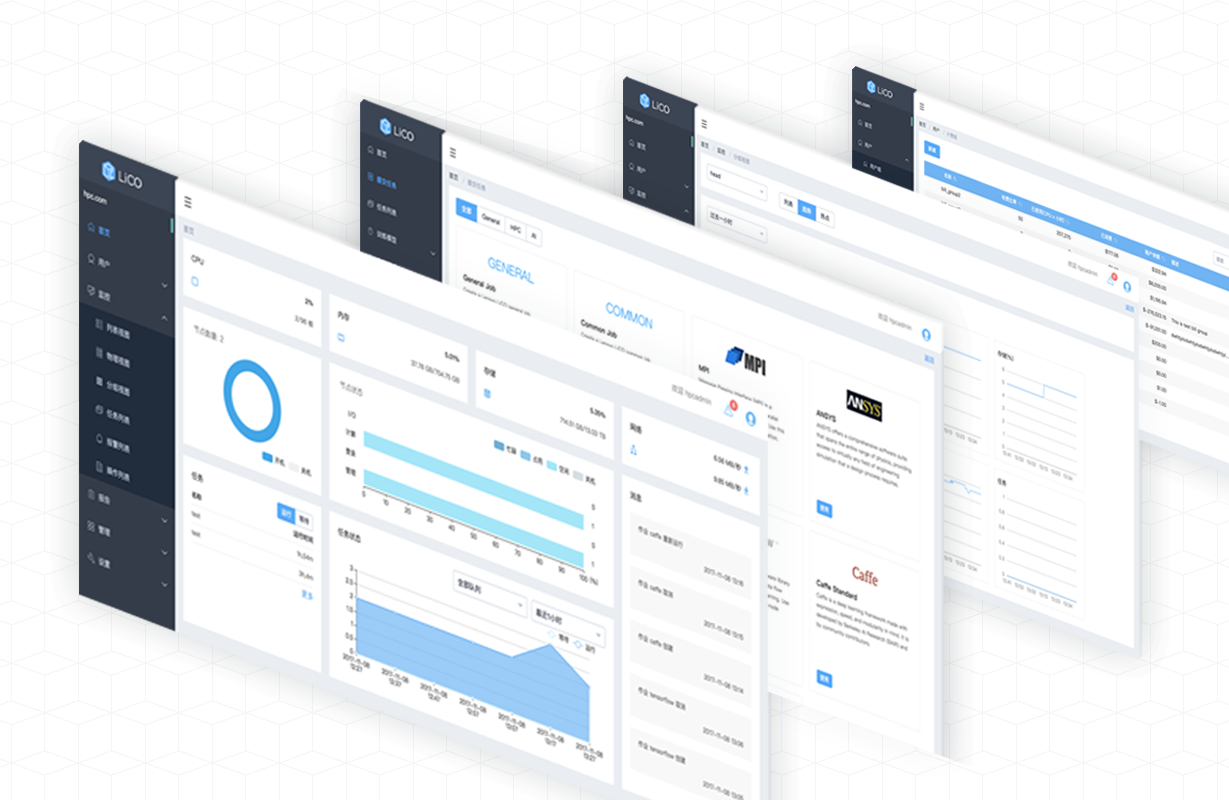
LiCO
LiCO accelerates Artificial Intelligence training and traditional High Performance Computing deployment by providing an intuitive user interface to manage your software and hardware stack.
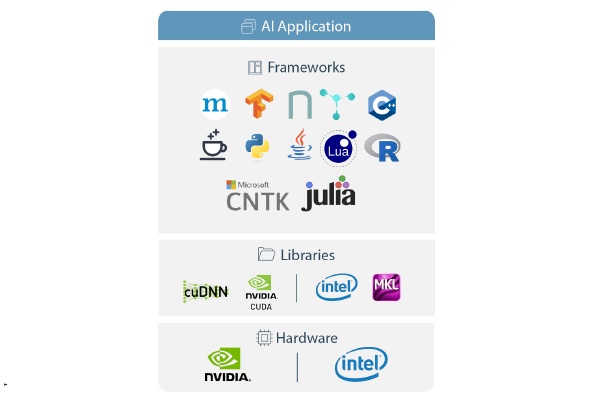
Supporting an extensive list of AI framework and open-source software, LiCO eliminates configuration complexity for users, reducing the time spent on setup and management of infrastructure. Optimized for the Lenovo ThinkSystem portfolio and supporting the latest Intel processor architecture and NVIDIA GPUs, LiCO puts powerful resources in the hands of researchers and data scientists.
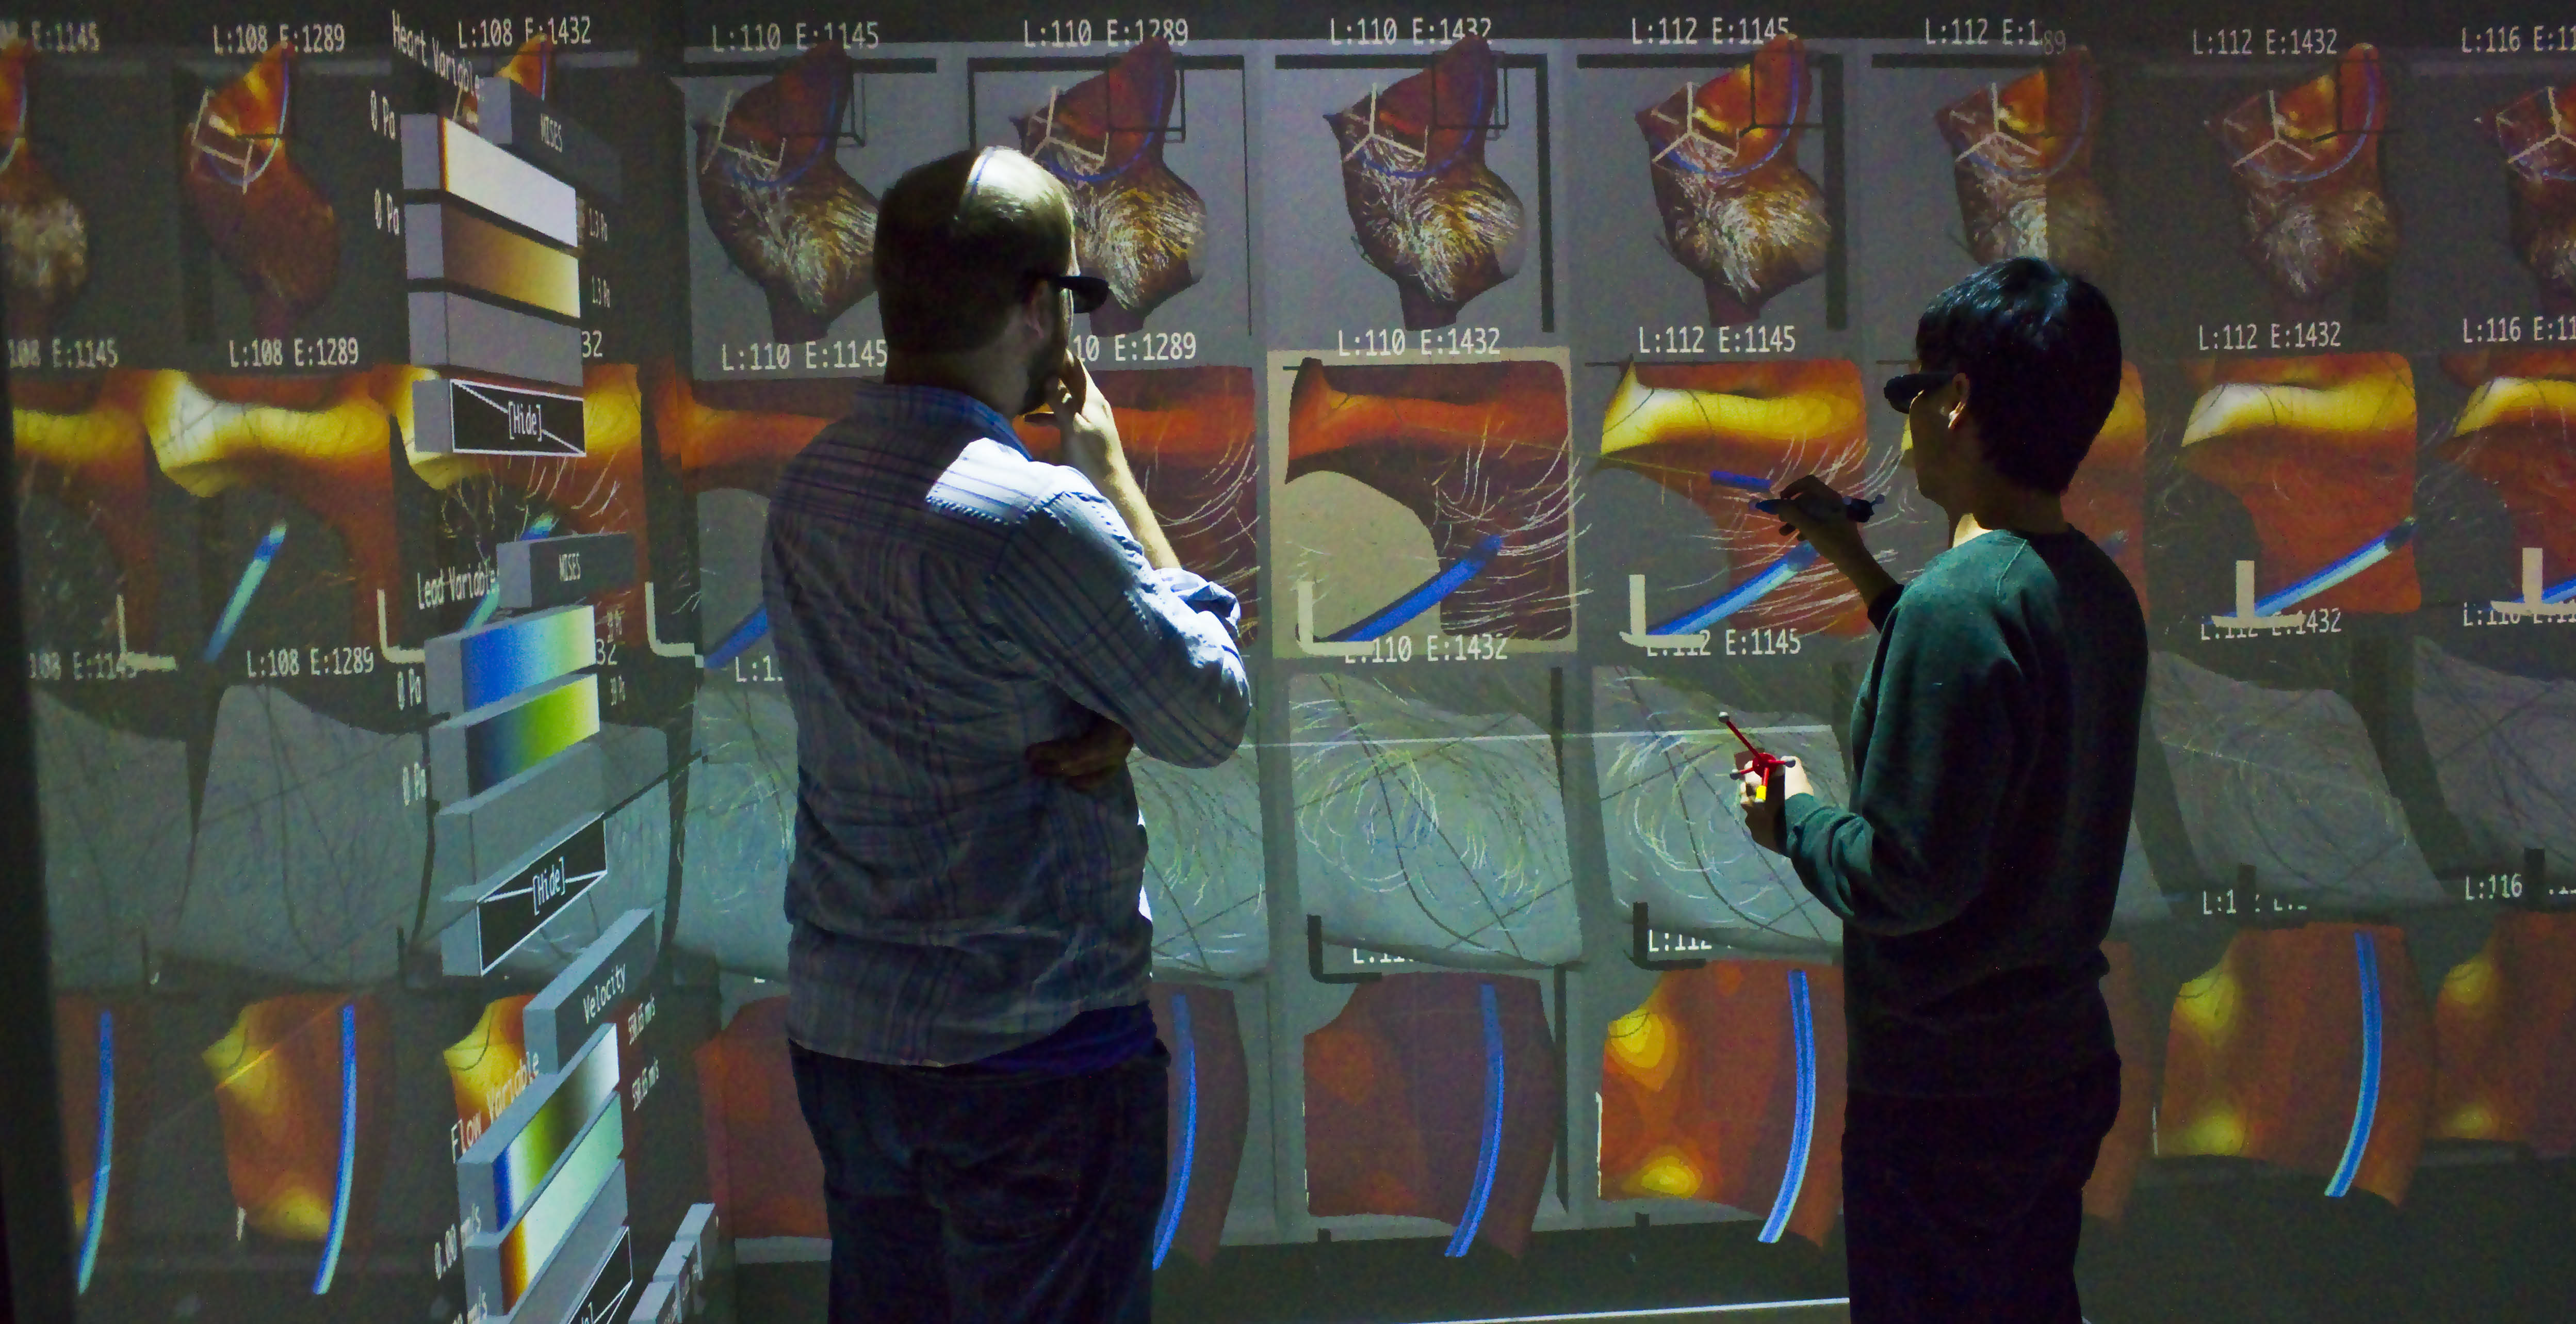
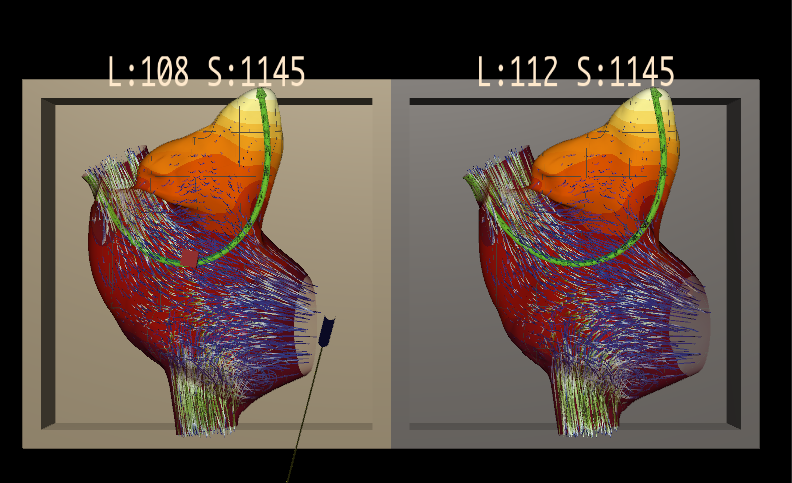
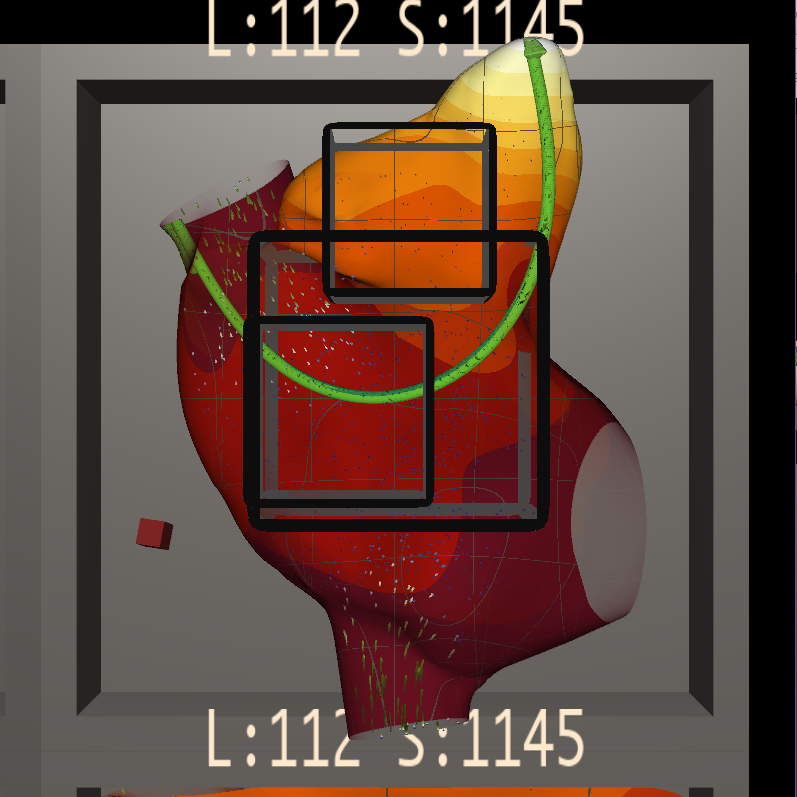
Bento Box
We will explore a virtual reality (VR) visualization environment of simulating the blood flow around a cardiac lead in the right atrium of the heart. Multiple time-varying data instances can be generated and selection of the sub-volume of interest created. This project is a collaborative tool between Dr. H. Birali Runesha and University of Minnesota.

RCC-Developed Online Frameworks
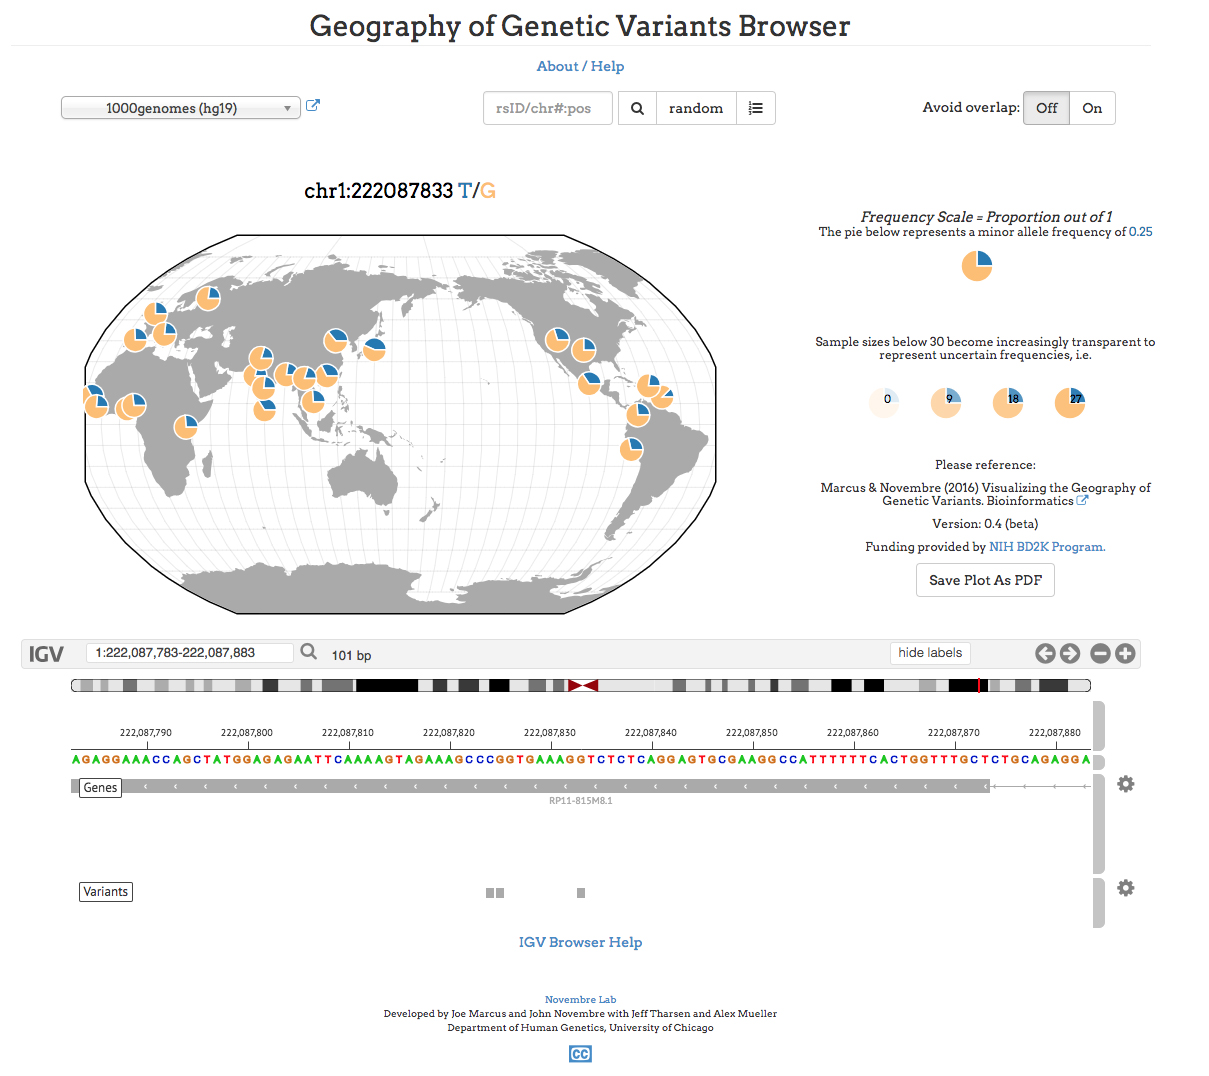
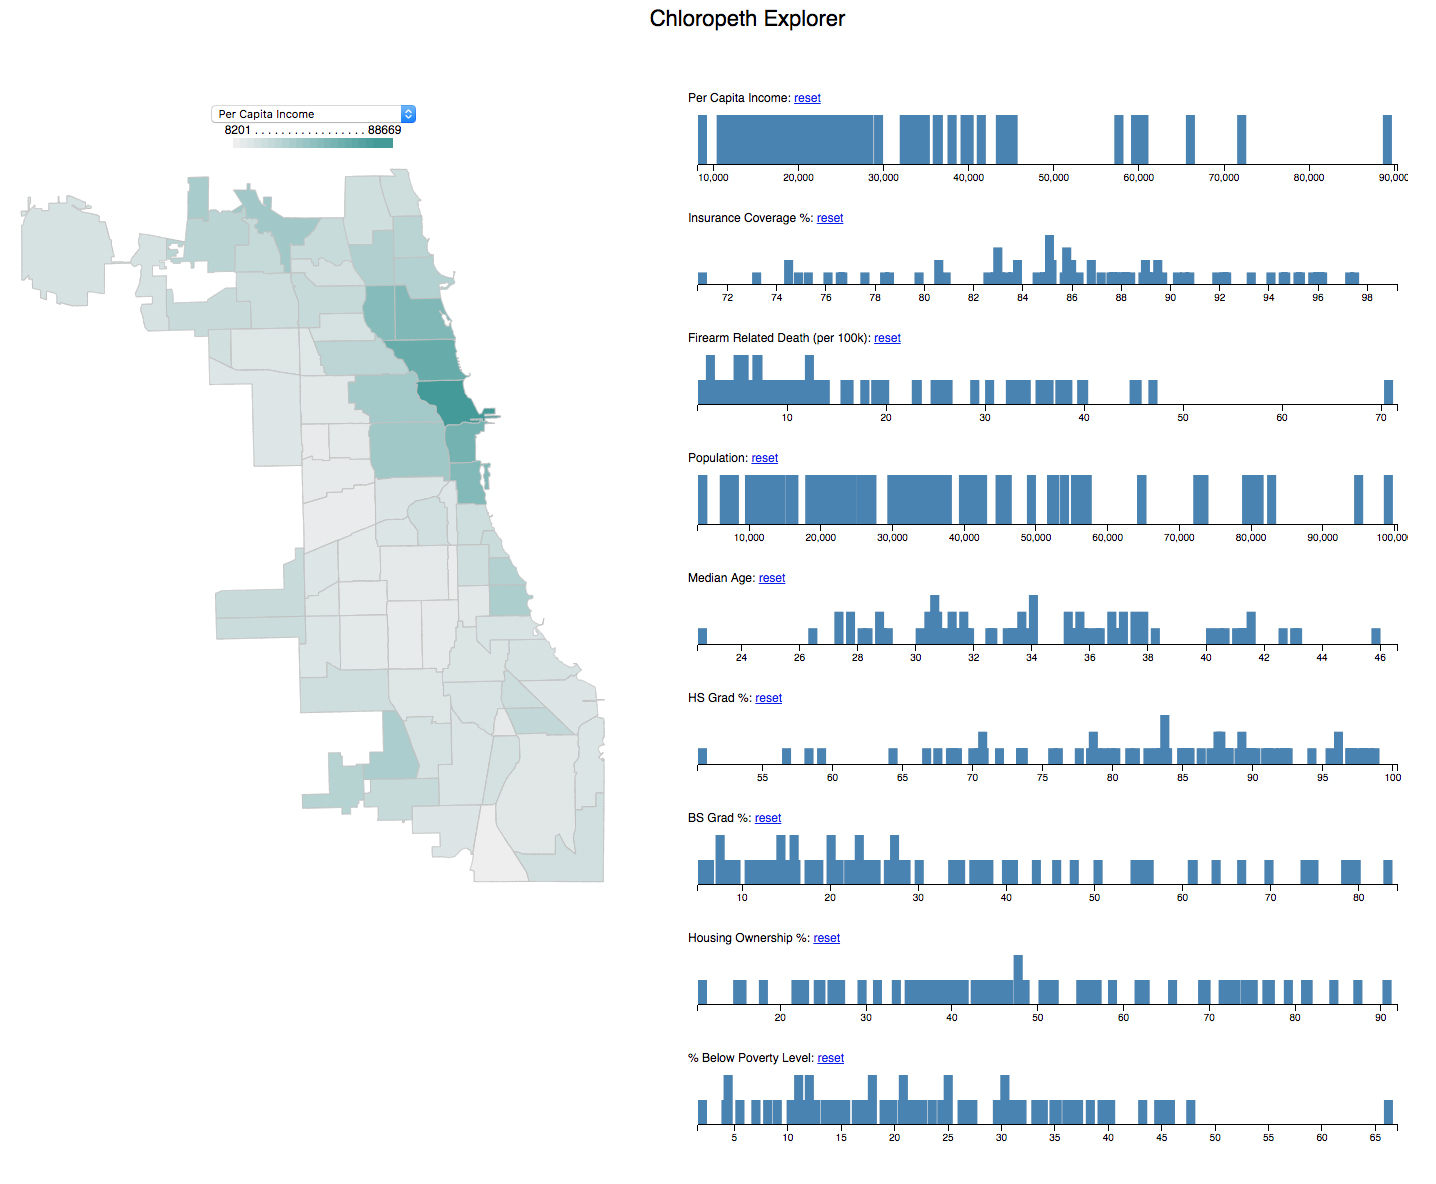
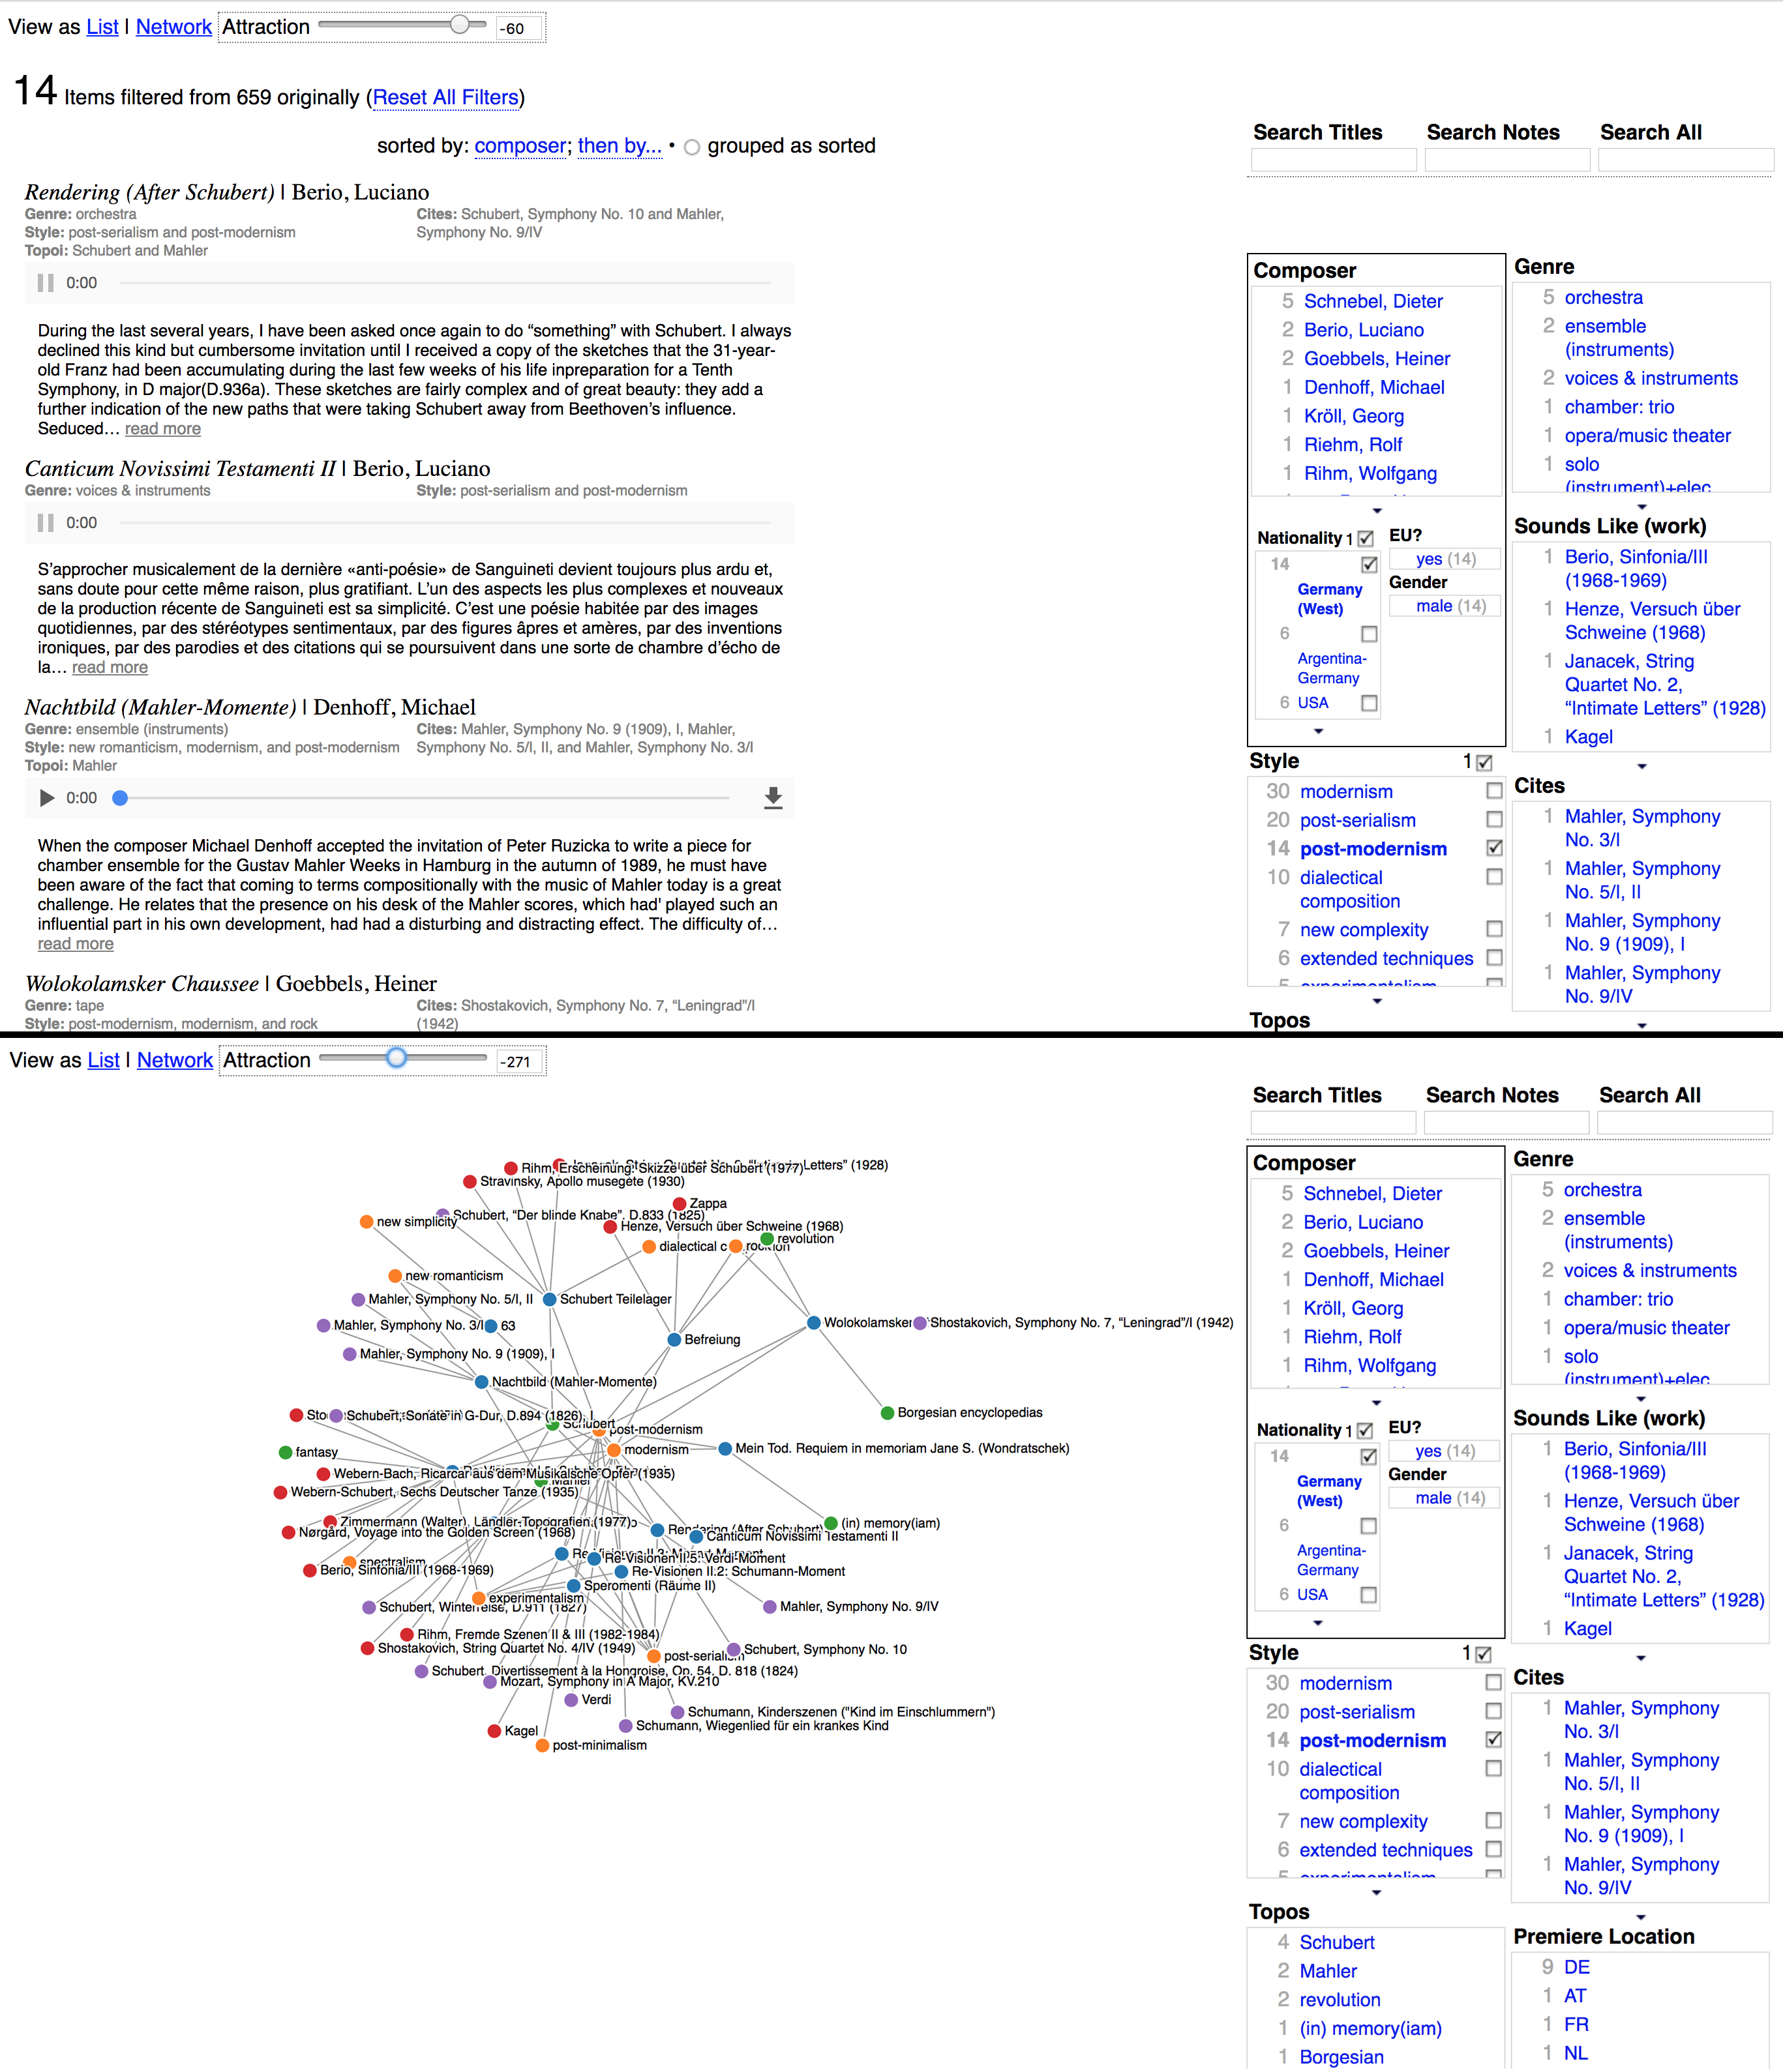
The Research Computing Center has recently developed or assisted in the development of several new types of online data-driven interactive visualization platforms. All four of these demos were built primarily using the Javascript D3 framework, and all represent unique and custom solutions to unsolved research questions originally brought to the RCC by UChicago faculty or graduate student researchers.

Qresp
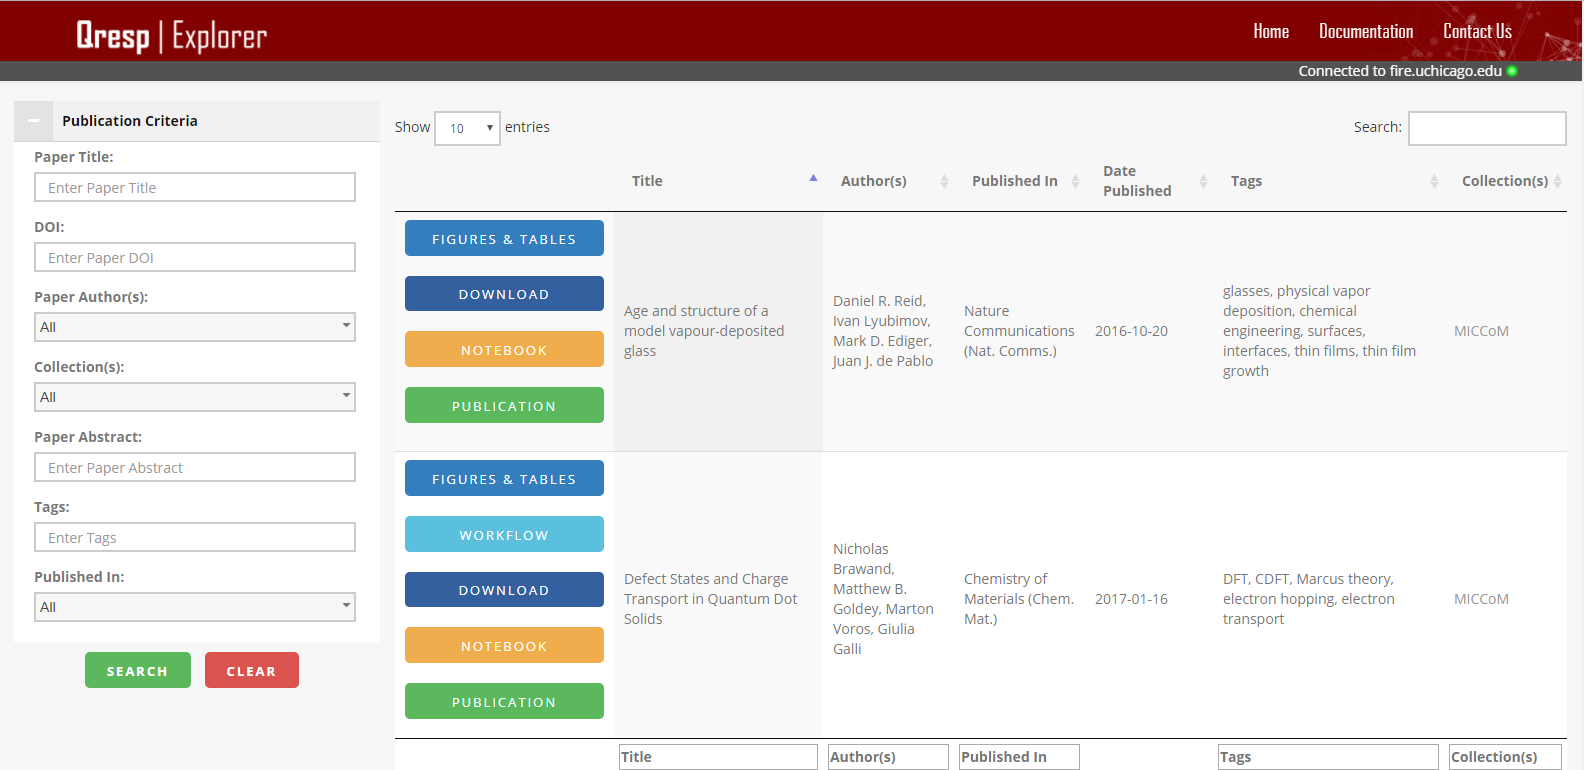
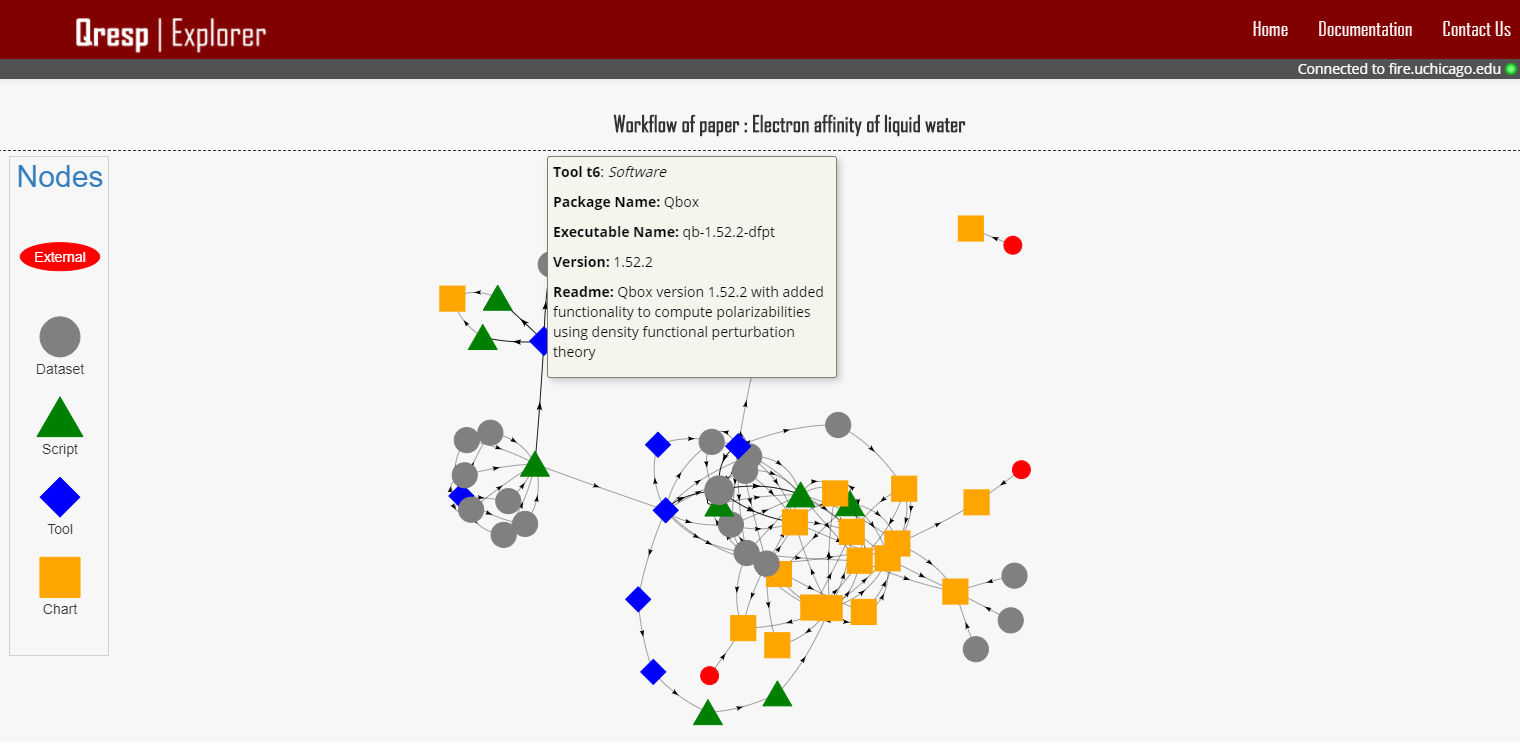
We will demonstrate Qresp, a simple tool that facilitates scientific data reproducibility by making available, in a distributed manner, all data and procedures presented in scientific papers, together with metadata to render them searchable. The graphical user interface (GUI) of Qresp is used to curate papers (i.e. generate metadata) and to explore curated papers and automatically access the data presented in scientific publications.
For more information visit http://qresp.org/


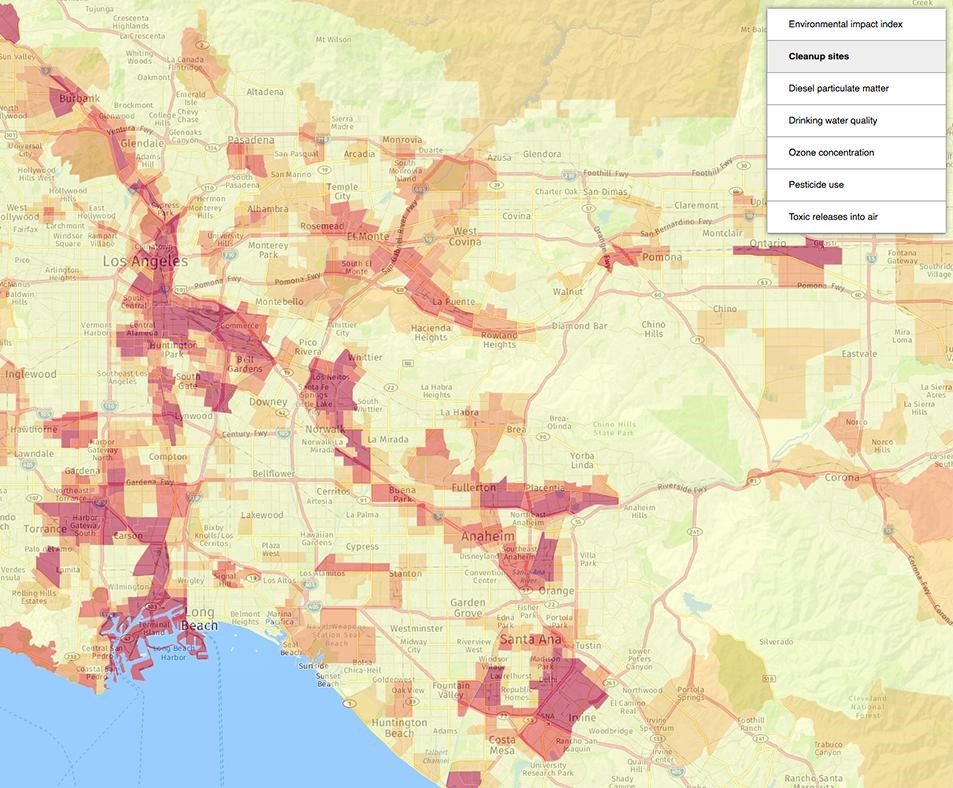
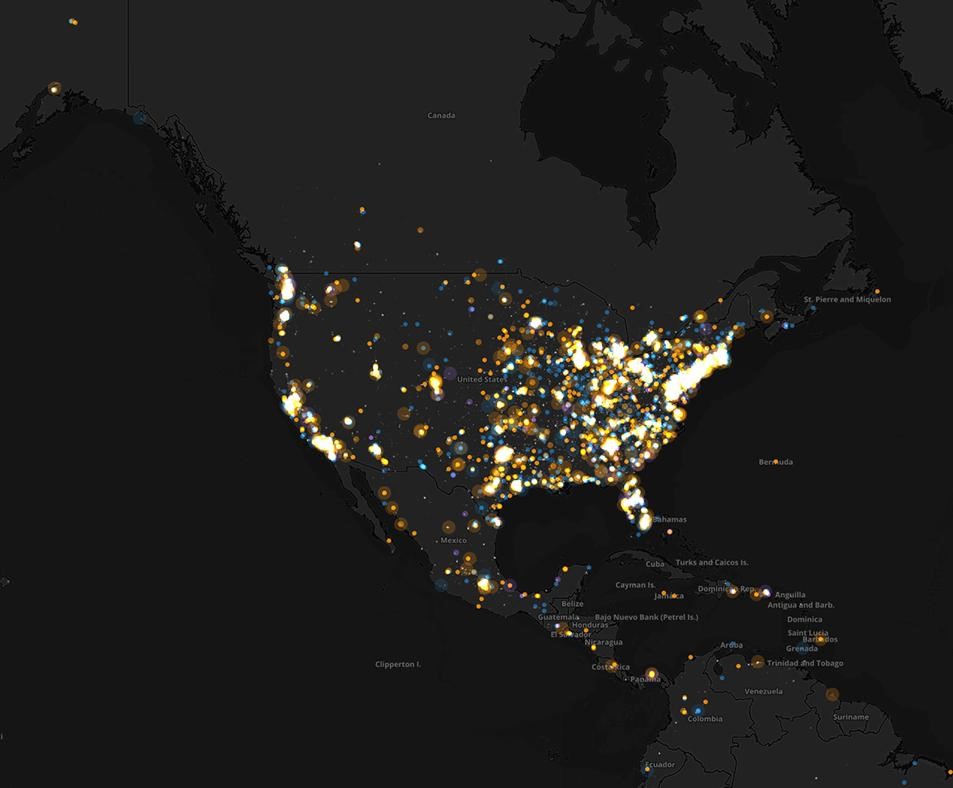
CARTO
CARTO is an open-source Software as that provides GIS and a web mapping tools for display in web browsers and mobile phones. Carto enables researchers to connect various database sources such as MySQL, SQL Server, PostgreSQL, and Amazon Redshift. Additionally, Carto can connect with services such as Google Drive, Box, and Dropbox. The platform is also friendly with third party tools such as ArcGIS, Qlik, Splunk, and Alteryx. Through Carto's database connectors, Cloud storage, and third party tools researchers can create rich data driven visualizations.